States Get Poor Grades On Learning Loss Transparency

Earlier this month, the Center for Reinventing Public Education released a report intended to answer the following question: how easy would it be for a parent or advocate to compare student performance pre- and post-COVID? The answer, following the report’s analysis of the ease of finding student performance data and other metrics, was that it was not at all easy for a large number of states.

All 50 states and the District of Columbia were assessed based on the ease with which researchers were able to find pre- and post-Covid data on a variety of metrics, including student achievement levels and achievement growth in English language arts, math, science, and social studies. Overall, 13 (25%) earned an F for the ease with with their longitudinal data could be found. (In some cases, the longitudinal data was not available at all). Only 7 (14%) earned an A for the ease with which their longitudinal data could be found, with 9 (18%) earning a B, 14 (27%) earning a C, and 8 (16%) earning a D.

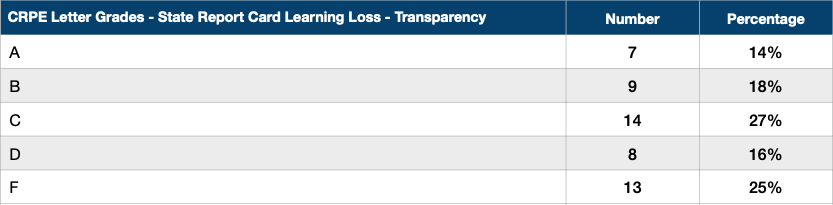
It’s important to note that the CRPE report was not intended to measure the quality of an individual state’s report card. The report itself noted that some states that had earned Fs nevertheless had easily navigable and “visually appealing” report cards. Rather, this report focused on whether states made it easy to compare pre-Covid data with post-Covid data across a variety of metrics. On balance, the answer was no, and even in “A” states, researchers still had trouble finding some of the metrics and/or disaggregated student data.

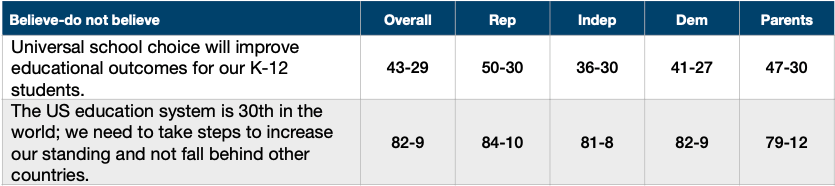
Still the lack of readily available longitudinal data means the work of ensuring students are getting caught up is that much harder. From the February survey for Winning the Issues, only 11% of voters thought students were where they normally would have been in their learning even accounting for the Covid disruptions. On the other hand, 27% said that they were significantly behind.

The Electoral College Trigger

One of the questions we are asked the most is about why polls were wrong in the 2016 election that saw the “surprise” win for Trump. Polling averages had shown significant leads for Clinton, but the race tightened during October; polls not in the field toward the end missed the movement toward Trump, with the final popular vote margin being 2.1%. To some extent, many of the polls in the fall of 2016 weren’t wrong, as much as there was a lack of consideration for what can happen in the Electoral College when the margin is under 3%.

As we approach another close election, all scenarios should be considered if the current trajectory continues. Today’s Real Clear Politics average shows a Harris lead of 1.5% with 538’s average at 2.6%. Most of the political discussion is about Harris leading, but both of these polling averages are within the 3% range.

Looking back over previous presidential elections, the 3% margin is a trigger for the outcome to be determined by the Electoral College more than the popular vote. In cases where there was more than a 3% popular vote margin, the popular vote and the Electoral College vote agree. However, when the popular vote margin is 3% or less, the Electoral College comes into play as the determining factor.

The chart below shows the results of the 10 closest elections since 1856, sorted by the popular vote margin. Numbers in blue mean the result favored Democrats, and numbers in red favored Republicans. Highlighted rows denote elections where the Electoral College winner did not win the popular vote.

Starting with the 1856 election, which was the first contest between a Republican and Democrat, there have been 42 presidential elections. In that timeframe, there have been 10 elections in which the popular vote was 3% or less. Of those 10 elections, 4 were won by the candidate who did not win the popular vote: 1876, 1888, 2000, 2016.

If the current presidential polling margin continues to stay within the 3% window, there is the possibility that the popular vote winner could lose the Electoral College. Based on these historical trends, there is a 40% chance this could happen if the margin is 3% or less. This scenario should be considered as we get closer to the election.

New Inflation Trending

This morning’s new inflation report showed a slight moderation in year-over-year inflation (2.5%) but with core inflation up 3.2% from a year ago. The year-over-year rate is the lowest since March 2021, the month that the American Rescue Plan was passed. But with inflation still well over 2%, this result seems to indicate there might be a smaller rate cut than Wall Street was hoping for, with markets initially dropping after the inflation news. While year-over-year inflation has moderated, prices are still not coming down. The Presidential Inflation Rate — the cumulative rate since the start of the Biden administration — remains over 20% (20.3%). The trend chart below shows the year-over-year rate (the red line) with the cumulative rate (Presidential Inflation Rate) in blue.

With the cumulative rate of inflation still over 20%, this means consumers are still not feeling relief. The cumulative rates of household expenses are still very high: food, 22.1%; gas, 45.8%; electricity, 30.7.%. The Harris campaign has pivoted from trying to sell good economic news as the Biden campaign had done with little success, to focusing on her plan to lower costs.

There is only one more inflation report (October 10) before the election, so the clock is running out on shaping the inflation narrative.

Roll Call: The popular vote: California versus the rest of the country

In today’s Roll Call, the Winston Group’s David Winston writes about a key indicator of electoral success: the winner of the popular vote outside of California.

For both parties, historical trends show that the “rest of the country” margins align more closely with an Electoral College victory and can be a valuable measure of what will happen in November. Given the closeness of the race, there is a serious possibility that the Electoral College could determine the outcome rather than the popular vote.

Read the full piece here.

Will We See More Campus Protests This Fall?

The fall semester is now in full swing at colleges and universities across the country. In preparation for students’ return, many schools updated their policies around protests, harassment, and discrimination, from the University of California and the California State University systems to Harvard University, Indiana University, the University of Virginia, and NYU. At the end of August, chair of the House Committee on Education and the Workforce Virginia Foxx and Missouri Rep. Jason Smith sent letters to institutions requesting that they share their updated plans for responding to campus demonstrations by September 5. Throughout the summer, several colleges and universities facing Title IV investigations were found to be lacking in their responses to antisemitism.

Protest activity has continued into the new semester, although at this point, it is not at the same scale we saw last spring. Cornell made headlines at the end of last month for campus demonstrations that included vandalism of school property. The Wall Street Journal reported last week that some 50 people protested at Columbia, and that a statue at the center of campus was vandalized with red paint. The story came only a few days after the WSJ also reported that a faculty task force “found antisemitism against students pervasive on the campus grounds—in dormitories, clubs and classrooms—and on social media.”

Colleges and universities find themselves in a precarious position with the electorate in how they choose to handle any protests that might arise this semester. From the April survey for Winning the Issues, conducted as the protest activity was ramping up last spring, only 19% of voters approved of how colleges and universities had handled the campus demonstrations (19-53 approve- disapprove). That shrank to 12% approving among independents (12-57).

Similarly, only 23% of voters overall said they agreed with the pro-Palestinian protests happening on college campuses (23-53 agree-disagree). Independents disagreed 19-54.

Voters were clearly dissatisfied with what they saw last spring. That independents were also dissatisfied indicates a larger potential problem that is not inherently partisan in nature. Whether the policy changes that colleges and universities made over the summer will effectively address student concerns and positively impact voters’ views is something we will continue to watch.

Comparing The Republican And Democrat Education Platforms

With the release of the Democratic Party’s 2024 platform for the start of their convention today, this week we take a look at how the Democrats’ platform compares with the Republicans’ on education.

The Democratic Platform: Education comes as part of the third chapter, “Lowering Costs;” the section addresses positions spanning through the education system from pre-K to post-secondary. Among the priorities are free, universal preschool for four year-olds; more affordable post- secondary education, including investments in career and technical education, free trade school and community college, and expanded Pell Grants; and increased investments in teachers.

“Help students learn.” The platform highlights actions the Biden administration took in the wake of the pandemic through the passage of the American Rescue Plan. It then highlights the Biden administration’s support of approaches that are “proven to help students learn,” including a longer school day and year; efforts to reduce chronic absenteeism; tutoring; literacy programs; and “helping schools to lift student achievement, rather than punishing them based on state standardized tests.”

Left undefined was how student achievement would be measured to indicate if improvements could be seen. Though the document expresses support for measures that help students learn, how can we know that the learning loss as a result of Covid-19 is being effectively addressed in the absence of standardized testing data?

The Republican Platform: The full 2024 Republican Party Platform was adopted at the Republican National Convention last month. Chapter 7, “Cultivate Great K-12 Schools Leading to Great Jobs and Great Lives for Young People,” outlines the platform as it pertains to education.

The chapter lists nine aspirations for education under Republican leadership: “Great Principals and Great Teachers,” which touches on schools focusing on “Excellence and Parental Rights” as well as ending teacher tenure in favor of merit pay; “Universal School Choice”“Prepare Students for Jobs and Careers”; “Safe, Secure, and Drug-Free Schools”; “Restore Parental Rights”Knowledge and Skills, Not CRT and Gender Indoctrination”; “Promote Love of Country with Authentic Civics Education”“Freedom to Pray”; and “Return Education to the States.”

Republicans focus on social issues. A major focus of the K-12 education platform is on social issues, including “expos[ing] politicized education models” in favor of career training programs, and “defund[ing] schools that engage in inappropriate political indoctrination of our children using Federal Taxpayer Dollars.” One of the twenty points included in the preamble of the platform is to “cut federal funding for any school pushing critical race theory, radical gender ideology, and other inappropriate racial, sexual, or political content on our children.”

Missing from the Republican document is any mention of improving student achievement or overcoming the learning loss students suffered during the Covid-19 pandemic.

A 25 Year Look At Education Issue Handling

Going into an election, one of the important metrics to look at is which party voters have more confidence in to handle issues that are important to them. Data from the latest survey for Winning the Issues (July 23-25) sheds light on which party voters have more confidence in to handle the issue of education, with trending Winning the Issues data allowing us to see voters’ responses in the context of the past. Looking at the long-term and recent past, two conclusions emerge.

1.) Over the last 25 years, Republicans have tied or beat Democrats in education issue handling only three times: February 2001 (+5 Republican Party), January 2002 (even), and April 2022 (even). No Child Left Behind was signed into law on January 8, 2002; the January 2002 survey fielded from the 21st to the 24th.

2.) Recently, the gap in education issue handling has been growing in Democrats’ favor, although not to the same extent seen in the late 2000s. Currently, education issue handling stands at +15 Democratic Party (36-51 Republican Party-Democratic Party), but the margins were as high as the mid-20s and 30s for Democrats at points in 2007-2009. Independents currently prefer Democrats on education 30-47, while parents prefer Democrats 32-50.

In the month prior, voters preferred Democrats by a margin of 10 (37-47). Independents were slightly less strong in their preference for Democrats (26-44), as were parents (39-44). Democrats went from 83% preferring their own party (7-83) to 91% preferring their own party (3-91).

As preference for Democrats on education appears to be growing, it remains to be seen if Republicans can get the policy discussion back to significantly improving student outcomes.

Universal School Choice And International Standing

The full 2024 Republican Party Platform was released and adopted earlier this month at the 2024 Republican National Convention. The platform devotes a chapter to education (“Cultivate Great K-12 Schools Leading to Great Jobs and Great Lives for Young People”), which focuses on issues like parental rights, career preparation, and a call for universal school choice.

The natural next question is what impact voters think universal school choice would have on K-12 education. Data from the latest survey for Winning the Issues (July 23-25), shows that, while voters believe universal school choice will improve educational outcomes for our K-12 students, it a plurality rather than a majority (43-29 believe-do not believe). Parents come closer to a majority (47-30), compared to Democrats (41-27) and especially independents (36-30). Republicans have the highest level of belief, but even then it is only one in two (50-30) for this plank of the party’s educational platform.

Voters were also asked to react to a second statement on education, this one adapted from a speech given at the convention: “In 2016, many people began to doubt the promise of America. … Our standing on the world stage was weak at best. … Our educational system was broken, ranked 30th in the world.”

Overall, 82% believed that the US education system is 30th in the world and that we need to take steps to increase our standing and not fall behind other countries (82-9). This statement had strong, bipartisan levels of belief (84-10 among Republicans; 81-8 among independents; 82-9 among Democrats), and a high level of belief among parents (79-12).

Clearly, voters understand that the US has improvements it could make when it comes to education.

The Value Of America’s Alliances

Last week was NATO (North Atlantic Treaty Organization) week in Washington, as the alliance celebrated its 75th anniversary and welcomed the soon-to-be new Secretary General, former Dutch Prime Minister Mark Rutte. Alliances are receiving a heightened level of attention as they relate to the conflict in Ukraine. Former President Trump and others have indicated they are open to changes with our alliances and pressing allies to pay more for security. From our research for Winning the Issues (June 14-16, 1000 registered voters), we explored foreign policy topics and how voters perceive the value of our alliances.

Conflicting beliefs in foreign policy: Seven out of ten voters believe that peace, prosperity and security are products of American leadership and sacrifice (70-16 believe-do not believe) with this belief consistent across party (75-14 among Republicans, 65-20 among independents, 70-15 among Democrats). However, there is also concern that the US has become overstretched. Two- thirds of the electorate believes that the US is overstretched with funding and providing military weapons assistance for international conflicts. We must focus on rebuilding our country (63-21). Republicans (72-14) and conservative Republicans believe this (75-14) at a high level, but this is also the case among independents (63-20) and Democrats (53-28).

With majorities of the electorate believing both statements, this outlook indicates a conflict of foreign policy beliefs. For example, 60% of conservative Republicans believe both statements — that peace, prosperity and security are products of American leadership and sacrifice (79% believing) and that the US is overstretched (75% believing).

Importance of alliances: Alliances are seen as important (91-6 important-not important) but with a generational difference among Republicans on the scale of importance. Republicans over age 45 view the alliances that the US has with other countries as being very important (64%) rather than somewhat important (27%), while among Republicans 18-44, there is a much a larger percentage viewing them as only somewhat important (42%) rather than very important (49%).

Alliances as effective peace-keepers: Although alliances are seen as important, their value as effective peace-keepers is less clear. A majority of the country (54%) believes alliances like NATO have kept the peace since World War II (54-27 believe-do not believe). On this question, conservative Republicans are split 41-41, with Republicans overall (45-37) tending to believe this but with belief less than 50%. In contrast, Democrats (67-17) believe this more than Republicans (45-37) and independents (50-29).

NATO has helped keep the peace since World War II, but this current belief system indicates that it is time for a redefinition of the value proposition of our global alliances in the modern context.

Roll Call: The Political System Is Blinking Red

The Winston Group’s David Winston writes in today’s Roll Call about the state of political discourse and rhetoric in the wake of the attempted assassination of former President Donald Trump.

The political discourse in this country has been driven by a focus on anger and grievance as a means to get and sustain attention and “eyeballs.” This focus has become the central element of political campaigns, and the media has adopted it as well. The impact of constant negative speech and negative news coverage is reflected in the country’s attitude toward the direction of the country. 

In the Real Clear Politics average, you have to go back to 2009 to even find parity between voters who thought the country was headed in the right direction and those who thought it was on the wrong track. That is a decade and a half. Today, the RCP average is 23 percent right direction and 67 percent wrong track. 

Read the full piece here.