Three Economic Narratives Republicans Should Expect in 2025

As President Biden is about to leave office, he’s working hard to frame his economic legacy in the most positive light. He has been giving a series of speeches to stake out the “Biden economic legacy,” shedding light on three economic narratives Republicans should prepare for:

1.) The Biden economy is in great shape to hand off to Trump. Any economic difficulties will be blamed on Trump and Republicans. This week, Biden said “Next month, my administration will end, and a new administration will begin. The new administration’s going to inherit a very strong economy…”

His record on job creation has been one he stresses as a key part of his economic legacy: “I had the greatest job creation record of any single president in a single term…over 6 million jobs.

2.) Inflation was caused by the pandemic, not Biden’s policies. Republicans have no plan to deal with inflation.

Biden: “The previous administration had no plan — no real plan, really — to get us through one of the toughest periods in our nation’s history. I’ve never been a fan of trickle-down economics. It was a hammer that was hammering working people.”

“I know it’s been hard for many Americans to see [economic progress]. And I understand it. They’re just trying to figure out how to put three squares on the table…But I believe [the American Rescue Plan and Inflation Reduction Act] was the right thing to do. Not only to lift America out of an economic crisis caused by a pandemic, but to set America on a stronger course for the future. And we did that.”

With every CPI report, Republicans should expect Democrats to focus on every negative aspect of inflation, and press Republicans about what policies they are offering to deal with the problem.

3.) Republican economic policies are the primary cause of the debt and deficits. As Republicans go into the 2025 tax discussion, Democrats are already laying the groundwork for the case that Republican tax cuts are the cause of the nation’s fiscal crisis:

Richard Neal, Ways and Means: “In the last three decades, Republicans have skyrocketed the deficit with trillions in tax cuts for billionaires and big corporations, always with the same result: the top 1% benefits while nothing trickles down for workers.”

Sheldon Whitehouse, Senate Budget: “In their blind loyalty to their mega-donors, Republicans’ fixation on giant tax cuts for billionaires has created a revenue problem that is driving up our national debt. Even as federal spending fell over the last year relative to the size of the economy, the deficit increased because Republicans have rigged the tax code so that big corporations and the wealthy can avoid paying their fair share.”

As the new Republican majority goes into its most complex legislative effort in several years, Republicans should prepare for the narratives coming against them and be careful not to make the mistakes of the Biden administration.

The Groceries Election, According to Trump

In an interview on Sunday, President-elect Trump attributed his win to a simple reason: ”Very simple word, groceries… I started using the word – the groceries. When you buy apples, when you buy bacon, when you buy eggs, they would double and triple the price over a short period of time, and I won an election based on that.”

Going into the November election, our presidential inflation showed a cumulative price increase of 20.7% since the beginning of the Biden administration, with food costs up almost 23% (22.8%.)

As some context for his statement, here are some of the economic numbers from the election:

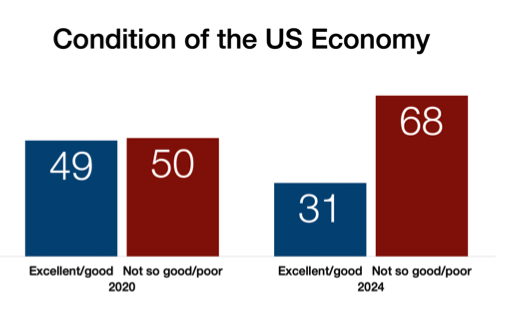
  • The condition of the nation’s economy was seen as negative: 31% excellent/good – 68% not so good/poor.
  • An overwhelming 75% of the electorate said inflation had posed some level of hardship for them and their families. 22% said inflation had been a severe hardship; 53% said a moderate hardship; while 24% said there had been no hardship.
  • Additionally, voters were asked who they trusted more to handle the economy, Trump or Harris; Trump won 53-46.
  • In the Winston Group post election survey of 1,250 respondents who voted, economy/inflation was the top issue at 40%, with immigration a distant second at 12%, and abortion right behind at 11%. No other issue was in double digits.
  • The challenge that clearly emerged for Biden and Harris was that voters’ view of the economy was much worse than in the last election. In the 2020 exit polls, 49% said the economy was excellent/good, while 50% said not so good/poor. In this election, it dropped to 31-68.

These numbers demonstrate why the Biden White House was never able to overcome the inflation issue, and why the Harris campaign’s inability to articulate policy positions was such a problem.

For more analysis, see our post-election report.

New Inflation Trending

This morning’s new inflation report showed a slight moderation in year-over-year inflation (2.5%) but with core inflation up 3.2% from a year ago. The year-over-year rate is the lowest since March 2021, the month that the American Rescue Plan was passed. But with inflation still well over 2%, this result seems to indicate there might be a smaller rate cut than Wall Street was hoping for, with markets initially dropping after the inflation news. While year-over-year inflation has moderated, prices are still not coming down. The Presidential Inflation Rate — the cumulative rate since the start of the Biden administration — remains over 20% (20.3%). The trend chart below shows the year-over-year rate (the red line) with the cumulative rate (Presidential Inflation Rate) in blue.

With the cumulative rate of inflation still over 20%, this means consumers are still not feeling relief. The cumulative rates of household expenses are still very high: food, 22.1%; gas, 45.8%; electricity, 30.7.%. The Harris campaign has pivoted from trying to sell good economic news as the Biden campaign had done with little success, to focusing on her plan to lower costs.

There is only one more inflation report (October 10) before the election, so the clock is running out on shaping the inflation narrative.

Deficit Claims From The Presidential Debate

Democrats are in full-scale panic after last week’s disastrous debate. Subsequent coverage has focused on the President’s performance, but today we are addressing one of the debate statements about the deficit.

In the debate, President Biden said: “He [Trump] had the largest national debt of any president in a four-your period, number one.” At the Office of Management and Budget’s historical tables page on the White House website, there is a file (table 1.1) that looks at the summary of receipts, outlays, and surpluses or deficits (-) from 1789 through 2029 (estimate). The OMB data shows a different picture. In Trump’s four years, the federal budget added 5.56 trillion dollars to the deficit. In Biden’s first three years, his budgets added 5.84 trillion.

Receipts in Biden’s first three years matched Trump’s four years, and the same comparison was true for spending. While Trump spent over 6 trillion dollars in 2020 to deal with COVID, each of the three prior years were under 4.5 trillion.

The difference between the two has been that Biden has normalized the COVID level of spending. In 2022 and 2023, he spent over 6 trillion, and the OMB estimate for 2024 increases to almost 7 trillion (6.9). In the projected four-year period estimated by OMB, President Biden’s federal budget deficits would reach 7.70 trillion dollars, which would be 2.14 trillion dollars larger than the four-year total for Trump’s presidency.

Weekly Wages Lag Inflation 5.5%

The latest numbers from the Bureau of Labor Statistics show that inflation has gone up 3.3% compared to this time last year, bringing the cumulative rate of inflation under President Biden since his inauguration – his Presidential Inflation Rate (PIR) – to 20.1%. But how does this compare to weekly wages?

Wages have increased 14.6% since President Biden’s inauguration, an increase but not as much as the rise in prices. Currently, wages trail the PIR by 5.5%.

This means that the purchasing power for the average family has decreased 5.5% since President Biden took office.

Biden Presidential Inflation Rate (PIR) Better Only Than Jimmy Carter’s

Data from the Bureau of Labor Statistics show prices rose 3.3% in May 2024 compared to May 2023, bringing the cumulative rate of price increases since President Biden first took office (the Presidential Inflation Rate) to 20.1%. This is the first time that Biden’s PIR has been greater than 20%.

But how does Biden compare to his predecessors?

The chart below shows the Presidential Inflation rates for Biden and the seven previous presidents at the same point in their terms (May of their fourth year). Only Jimmy Carter has a higher rate of inflation (39.8%) than Biden.

Biden Presidential Inflation Rate (PIR) Breaks 20%

The new numbers from the Bureau of Labor Statistics for May 2024 show that inflation has increased 3.3% compared to this time last year. But the Presidential Inflation Rate (PIR) has crossed the 20% threshold (20.1%).

This means that prices have increased about 20% since President Biden first took office.

Biden Ad Analysis By Level Of Education

Recently, the Winston Group released its latest video analysis, looking at the Biden campaign’s “For You” ad. The analysis confirmed what we have observed in past surveys and analyses: President Biden has a credibility problem, especially when it comes to the economy, and has made many statements that voters do not believe. This is particularly true when it comes to key voter groups like independents.

Voters were shown the ad and rated it second by second on a 1-9 scale, with 1 being much less favorable to Biden, 5 being neutral, and 9 being much more favorable to Biden. At the end of the ad voters overall rated it at a neutral 4.9. Among voters with less than a bachelor’s degree (4.8), bachelor’s degrees (5.1) and postgraduate education (4.8), reaction was similarly muted. Typically a 6.0 is a good positive response, and 5.5 a reasonable response. In this case none came close to either of those levels.

The chart below shows the statements in the order they appeared in the ad. Looking at the first three, which set the tone for the remainder of the ad, none of them were believable, for voters overall or by level of education completion. This was especially true for the statement that the US has the strongest economy in the world (30-58 believe-do not believe among voters overall).

Not all of the statements in the ad were unbelievable. A majority overall and by education level believed that Joe Biden passed the law that lowered prescription drug prices and caps insulin at $35 a month for seniors (62-28 among voters overall; 60-29 among voters with less than a bachelor’s degree, 67-26 among voters with a bachelor’s degree, and 66-27 among voters with a postgraduate education).

Overall 9 out of 10 statements did not have a majority believing it. That was true for those with less than a bachelor’s degree. For those with a bachelor’s degree it was 5 out of 10, and among those with a postgraduate education, it was 4 out of 10. That lack of believability resulted in an ineffective ad.

Is Biden’s Blue Wall Collapsing Over Inflation?

Surveys show President Biden in deep trouble, but Democrats believe voters are disengaged and they have plenty of time to get their message out. Some are choosing to ignore surveys that show Biden behind, which is similar to Republicans that didn’t believe polls showing anything other than a Red Wave in 2022.

Democrats would be wise to heed the warning signs and take advantage of the time. Inflation is the central problem that haunts the Biden team nationally and in the states, and the White House hasn’t yet found a compelling economic message that voters believe. Our latest look at the presidential ranges shows the President having significant ground to make up. Ranges are based on the Real Clear Politics averages, removing outliers of the highest and lowest poll results for each candidate. This allows us to see the highs and lows for the candidates, and how much room to run each candidate has. As shown in the chart, Biden underperforms Trump nationally and in the Blue Wall States.

What Democrats see as Biden’s Blue Wall is the group of states (MI, PA, WI) that comprised Trump’s 2016 Rust Belt Coalition. Several traditional Democratic voter groups shifted toward Trump from 2012 to 2016, producing the “Rust Belt Surprise.”

Voters that were critical to Trump’s 2016 win were those who said the economy was “not so good.” According to the exit polls in 2012, 23% said economic conditions were excellent/good and 77% said not so good/poor. In 2016, it was 36% excellent/good – 62% not so good/poor. A key group were those voters who said the economy was “not so good.” In the 2012 election, this group made up 45% of the electorate, and Romney should have carried them. Instead, they went for President Obama by a 13-point margin of 42-55. In this election, they made up 41% of the electorate, and Trump carried them by 13 points at 53-40.

The results in the Rust Belt states displayed this shift on an even a larger scale. The largest shift was in Michigan where President Obama had previously won these voters by 18 points. In 2016, Trump won these voters by 26 points, a 44-point swing. It is not simply that he won these voters in this set of states after Romney had lost them; it was the magnitude of the results gained. With inflation being a top voting priority, the possibility is there for this to happen again.

Newt Gingrich: Bidenflation at the Grocery Store

Newt Gingrich cites our inflation numbers in his commentary yesterday:

Winston and Miller rightly make the point that the impact of the economy over an entire presidency is far more useful than tracking one or two months. Viewed over the entire Biden presidency, the economic pain is beginning to resemble the Jimmy Carter years, when people felt everything was out of control.

Read the full piece here.